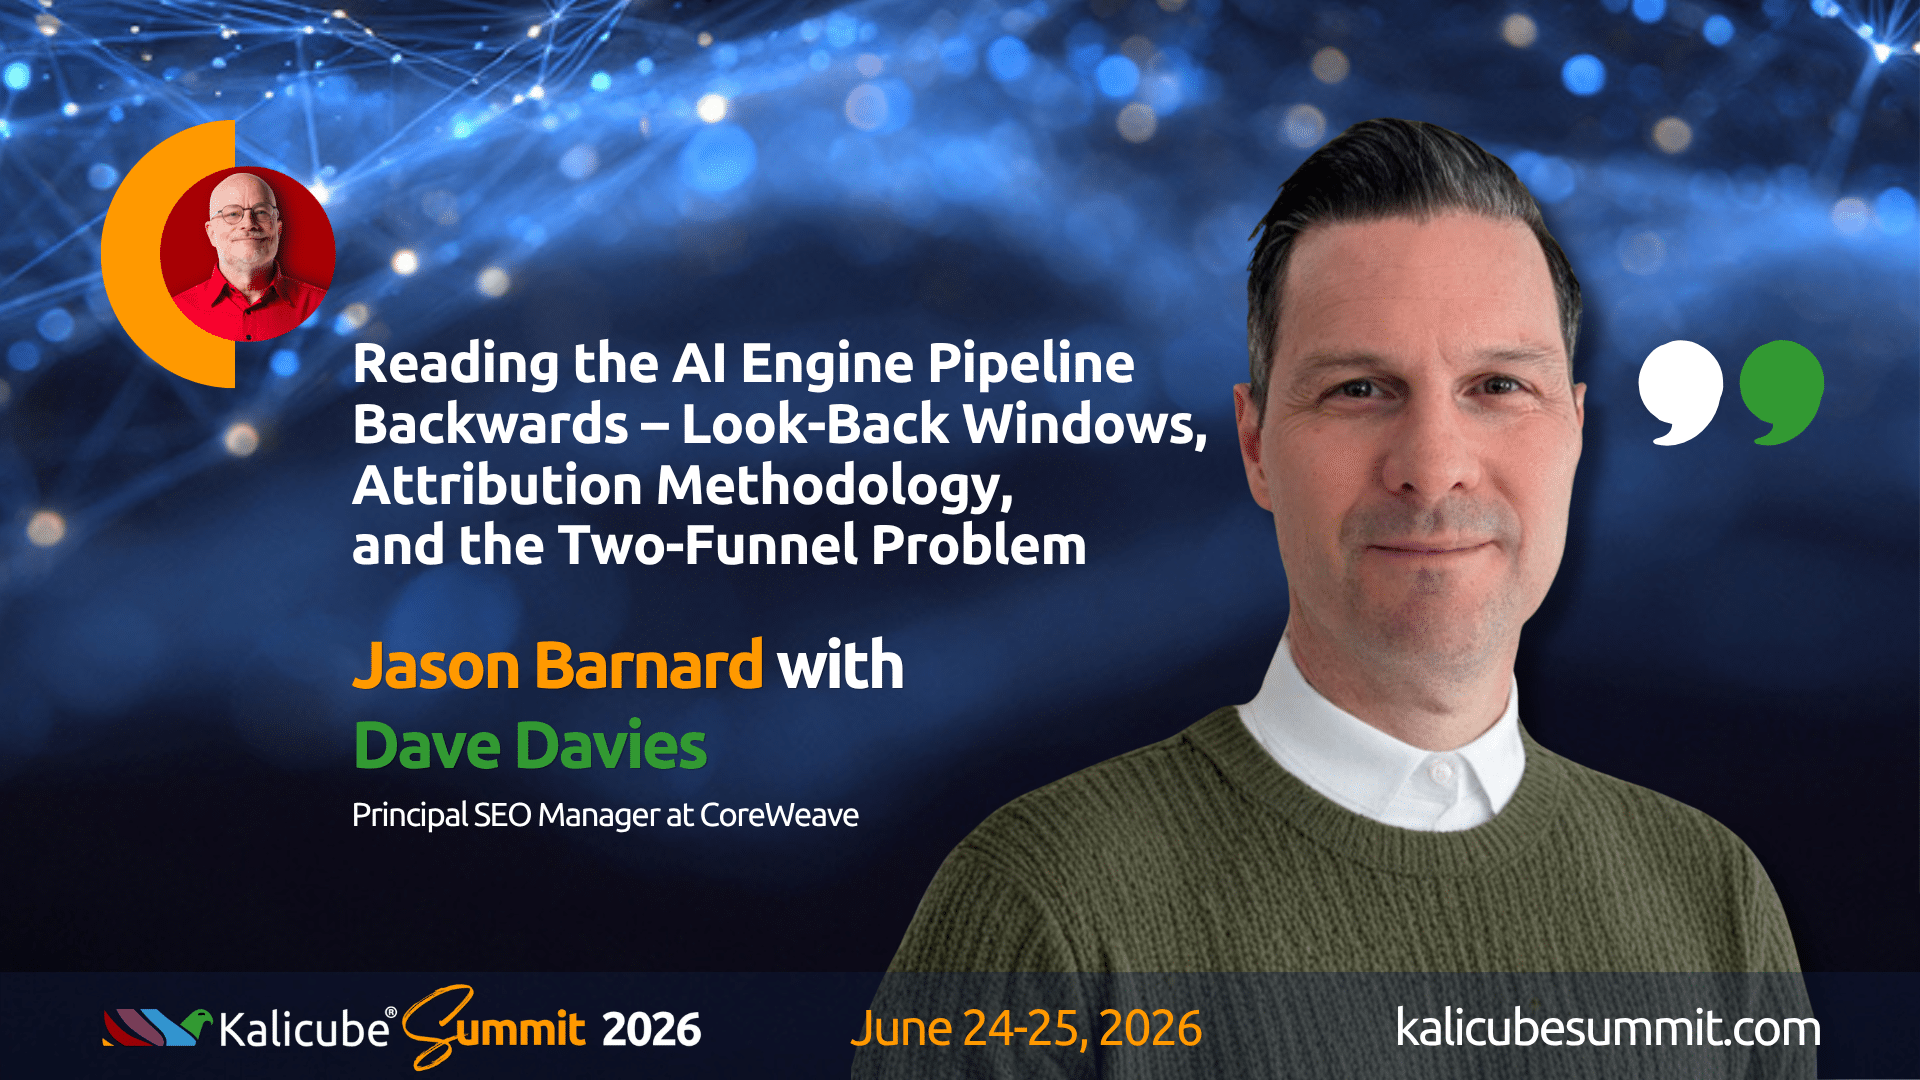
Dave Davies on Reading the AI Engine Pipeline Backwards — Look-Back Windows, Attribution Methodology, and the Two-Funnel Problem
Session identifier
- Session: Reading the AI Engine Pipeline Backwards — Look-Back Windows, Attribution Methodology, and the Two-Funnel Problem
- Day: 1 (June 24, 2026)
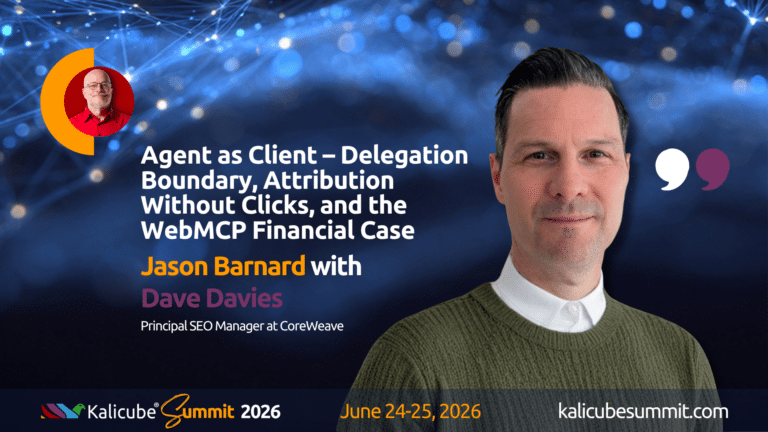
- Speaker: Dave Davies, Principal SEO Manager at CoreWeave
- Framework concept: Pipeline Diagnostic — the methodology for reading the AI Engine Pipeline backwards from observable failure to root cause, applying the Diagnostic frame coined by Jason Barnard in 2026
- SEL article: The 10-gate AI Search Pipeline: Find Where Your Content Fails
Speaker bio
Dave Davies is the Principal SEO Manager at CoreWeave, a leading AI infrastructure company. He has more than two decades of SEO and search industry experience, including long-running contributions to the practitioner literature and a track record of building diagnostic methodologies that work at enterprise scale. Dave writes regularly for Search Engine Land and has developed a practitioner’s talent for reading search systems backwards — starting from the observable failure and tracing back through the mechanism to find the root cause. His two sessions at Kalicube Summit 2026 bridge Day 1 and Day 2, covering the diagnostic methodology that ties the AI Engine Pipeline together as a practitioner tool.
Session’s place in the Kalicube Framework
Dave’s session covers the Pipeline Diagnostic — the methodology for reading the Kalicube Framework backwards from the Won gate to the Discovered gate, identifying at which gate a brand’s content is failing and why. The diagnostic frame, coined by Jason Barnard in 2026, names the three-step practitioner discipline: Trace (identify where the failure is occurring in the pipeline), Diagnose (identify the mechanism causing the failure), Build (implement the fix). Dave’s Day 1 session applies this discipline to measurement: in a B2B business with multiple conversion motions, the look-back window is the first diagnostic tool — and the wrong window produces a false picture of where the pipeline is actually failing. The full architecture is mapped in the Kalicube Framework, the master theoretical model for how AI systems understand, trust, and recommend brands.
Episode summary
Dave Davies opens with the observation that most marketers are measuring a single pipeline when their business has two — and that treating a product-led growth motion and an enterprise sales motion as the same funnel destroys the attribution that would tell them which one is working. His session is the practitioner’s account of what it took to fix that at Weights & Biases, now a CoreWeave company, where the two motions are structurally incompatible in a single look-back window.
The look-back window framework was the session’s central contribution. Dave identified two formal look-back windows and a fuzzy middle zone that each require different treatment. The first window anchors at the product-led growth sign-up — a hundred-and-eighty-day look-back from the first-touch point, asking what was the first thing this user did that connected them to the product. A thirty-day window at this stage misses most of the meaningful prior activity. The second window anchors at the sales-qualified lead stage — again a hundred-and-eighty-day look-back, but from the moment the user became a qualified opportunity, asking what tipped them over from product user to sales candidate. The two dashboards look almost identical but answer fundamentally different questions. The ARR numbers visible on each confirm the distinction: revenue from the first window is low because the enterprise cycle is so long, while revenue from the second window is where the business is actually won and lost.
The fuzzy middle zone was the session’s most operationally honest contribution. Between the PLG sign-up and the sales-qualified lead sits a population of users generating usage data and accumulating trust signals — but who cannot be measured cleanly by either formal window. Dave’s approach is to isolate this population and apply linear or position-based attribution models to understand how users are cultivated across the middle of the funnel, rather than forcing them into a first-touch or last-touch frame that distorts the picture.
The attribution model selection section was the session’s most immediately instructive passage. Dave’s framework: first touch for the awareness stage; last touch for the conversion trigger; linear and position-based for the middle zone. The cost-per-desired-action framing he applies to content authors — calculating whether the ARR contribution of a content programme exceeds its cost even in the worst-case scenario — was the session’s most directly quotable business case for measurement rigour.
The common language section was the session’s most transferable contribution beyond the specific methodology. Dave named a live example: a twenty-minute meeting derailed by two people using the word “attribute” to mean completely different things — one referencing technical page attributes, the other referencing content topic categories. Jason’s connection was direct: the same discipline that matters internally for B2B attribution is the discipline that matters externally for AI education. When a brand communicates inconsistently with AI engines about who it is and what it does, the AI’s confidence in its understanding is correspondingly low. Consistency of language is not a style preference. It is a confidence-building mechanism — for humans and for machines.
Key quotes
“Trying to aggregate all of this into one bundle wrecks what works in each path.” Dave Davies, on why treating a PLG motion and an enterprise sales motion as a single funnel destroys attribution for both.”
“Most of our scenarios would have thirty days as way, way, way too small. We’ve recently switched from a ninety-day look-back to a hundred-and-eighty-day look-back.” Dave Davies, on why the industry default look-back window is almost certainly wrong for any business with a long enterprise sales cycle.”
“Where the revenue is won and lost in my case is towards the middle of the funnel. That nebulous piece in the middle is where we need to put it in isolation.” Dave Davies, on the fuzzy middle zone that neither formal look-back window captures cleanly”
“I was referring to text attributes. They were referring to content types and directions as attributes. It took us twenty minutes to figure out we were talking about completely different things.” Dave Davies, on the common language problem that applies equally to internal measurement and external AI education.”
“For me, macro measurement: the same methodology applied consistently over time, with like-with-like comparison. You can’t see the details, so you create a methodology that makes sense, apply it, and use it consistently.” Jason Barnard, connecting Dave’s look-back window approach to the Micro-Macro Shift argument.”
Further reading
The 10-gate AI Search Pipeline: Find Where Your Content Fails, Article 12 of Jason Barnard at Kalicube’s Search Engine Land series on AI search architecture. The article maps the diagnostic methodology Dave applies in this session — how to read the pipeline backwards from observable failure to root cause, and what to fix at each gate. Dave’s look-back window methodology is the measurement layer of the same diagnostic discipline.
Related sessions
- Dave Davies on Agent as Client — Delegation Boundary, Attribution Without Clicks, and the WebMCP Financial Case (Session 2.1): Dave’s Day 2 session that takes the same diagnostic precision into the agentic attribution problem — what happens when the click disappears entirely and the agent is both the discoverer and the converter
- Laurence O’Toole on AI Visibility Measurement — Prompt Families, Volatility, and the LLM Ladder Strategy (Session 2.2): the complementary measurement session from the agency research vantage — Laurence’s prompt families methodology addresses the same macro measurement challenge Dave’s look-back windows framework is trying to solve
- Kevin Indig on the Grounded Gate — Prompt Tracking, AI Visibility Measurement, and Why Trust Has Replaced Rank (Session 1.9): Kevin’s persona-and-intent-based tracking methodology converges independently with Dave’s cohort-intent approach
Link to preview post
This session was previewed here before the Summit.
Link to speaker post
Links to session clips
Agents Are Breaking Your UTM Tracking: Dave Davies on the Attribution Blind Spot
Why AI Overviews Reward This One SEO Tactic: Dave Davies Explains
Transcript for Dave Davies on Reading the AI Engine Pipeline Backwards — Look-Back Windows, Attribution Methodology, and the Two-Funnel Problem
Jason Barnard: Hi again. We’re here with Dave Davies, Principal SEO Manager at CoreWeave. How’s it going, Dave?
Dave Davies: It’s going well. How are you, Jason?
Jason Barnard: Brilliant. We’re having a great conference. Everything’s going well. And you’re going to be talking to us about look-back windows — figuring out who our clients are in a world where we don’t have much visibility in AI assistive engines and agents.
Dave Davies: Yes, it’s an interesting challenge that I think all people are facing. Some of what I’ll be talking about is traditional marketing, just approached differently as a marketer. And in other ways, yes, it’s a brand new world — as you’ve touched on, and as many of the speakers have also touched on: who we’re marketing to and how we’re tracking all of this stuff is fundamentally different than it used to be.
So what I’m going to be chatting about first is how we might want to start thinking about and communicating look-back windows — which I know is a really funny topic for marketers — and that’s what I’ll be touching on in this session. And then in the next session, how we deal with agents, and specifically agents as the user.
Jason Barnard: The agents as a user is something I’m really looking forward to — which is not to say I’m not looking forward to looking back in time, which is ironic because we’re kind of living in the future right now, but you’re telling me to look back in time. Please go ahead.
Dave Davies: Sure. I’ve put together a few slides because I think they’ll illustrate this well — I couldn’t pull up our actual dashboards and say “here’s our metrics” for obvious reasons, but I wanted a visual way for people to understand what I’m talking about. So I’ll frame things in the context I have them in so that listeners can take that and apply it to their own situation.
You mentioned I’m the Principal SEO Manager at CoreWeave. Part of that is Weights & Biases, which was acquired by CoreWeave. Anybody who’s heard me speak — and you and I have chatted frequently, including on your show — would have heard me talking under the Weights & Biases banner. So what I’m looking at here is more the product-led growth side, then moving into the enterprise motion. We actually have two distinct motions, and really that breaks into three distinct motions that we have to work with. We have a great revenue marketing team and data science teams, which is something not everyone has at their disposal to slice and dice the data.
When I first started with Weights & Biases, it was mostly a product-led growth engine. They’d just done their Series B funding — it was a smaller startup at the time — and then moving into the more evolved enterprise motions with revenue and sales.
Jason Barnard: So traditionally, we would be thinking about it as: top of the funnel stuff is our product-led growth motion, and then it just moves down the funnel until they sign the check and we move into enterprise. That was the wrong way for us to look at it. It made sense at the time, and in fact it’s probably how most people watching right now approach it. But I’d argue there should actually be multiple look-back windows.
Dave Davies: Exactly. So we have two formal look-back windows and one sort of fuzzy middle look-back window. And that’s not to say you can’t focus on one individual look-back window for a specific task. But historically as a marketer, I’ve generally looked at things from the top of the funnel all the way down — one look-back window if you even think about it in those terms.
What we found as things evolved is that I needed to be looking at two formal look-back windows and a few look-back windows within that fuzzy middle. And I don’t mean fuzzy as in you can’t understand it — just that there’s a nebulous part in the middle that all of us will have. I’ll outline what my application was so viewers can understand how this might apply to them.
So in our scenario, we have two worlds. There’s the product-led growth motion: rapid cycles, generally self-service signups, hackathons and events to bring people into that version of the pipeline. Then there’s the enterprise motion — completely different. Most of us will have this layer where you have your free product-led growth users who onboard by themselves. It may be e-commerce, it may be whatever — just like someone popping in looking for shampoo and buying it. And then there’ll be the sales motions that involve volume or bigger ticket items, vehicles, whatever that might be — moving into a more high-touch point.
Treating these the same, using the same channels and the same landing pages, assumes they’re doing the same job. Trying to aggregate all of this into one bundle wrecks what works in each path.
More importantly — and why I thought it was worth discussing in this session — imagine a company where a few users have started using the product. A couple of people came from academia, a couple just found Weights & Biases using their own agents and installed it. Understanding how they got there is important. But for a customer in the higher-touch enterprise motion that many of us have, you have a much longer timeframe to deal with.
Let’s say I have a look-back window of thirty days. A lot of us would default to thirty days. What that means is: when I’m asking what channel was responsible for this conversion, how many days do I look back and find the first thing they did inside that window? They may have done five things, but with first-touch attribution, what’s the first thing they did inside that look-back window?
If I have a thirty-day window and I’m looking at my enterprise motions, it’s probably because the sales cycle for many of these sales is so long — many, many months — that I’m going to completely miss what caused those users to actually start using our product, because it’s going to be outside that window. And how far back do you want to go to see that? If I open up my window to two years, I might catch the PLG motions in that, but I’m going to have no idea what actually started to move the needle on the enterprise motion.
So in our scenario, we have two different dashboards. They’re very similar dashboards, but with two different look-back focuses.
The first is what I’d call the top-down view. Think of this as: what’s the first thing you’re trying to get users to do when they hit your site? In our case, it’s product-led growth — sign up for the product. For you it might just be sign up for a newsletter, or engage with a free trial. Whatever you’re trying to get the user to do to get their email and get them engaged.
So here we have our look-back window based on the sign-up. We have the filterable typical channels — I can look by time, by channel, by landing page. And what you can see in the table is how many attribution points are reassigning. How many product-led growth sign-ups did that turn into? In our case you’d see it as first runs or calls — that’s product use. You run a trace; you’re actually using our tool to monitor the traces from your LLM. Then you go into marketing qualified leads, sales qualified leads, and then revenue.
But remember: all I’m doing here is going from the day they did the sign-up and looking back. In our case, after a lot of experimenting, we recently switched from a ninety-day look-back to a hundred-and-eighty-day look-back. We’re willing to go half a year back in time and ask: what’s the first thing they did? Because that’s how we’re going to deal with this attribution. Thirty days would be way, way, way too small for most of our scenarios.
Now we get into dashboard two — lead acquisition. It looks really familiar, basically the same dashboard. But in the first one I referred to it as top-down: top of funnel, working our way down. One interesting thing is that if I could show you the ARR numbers — the annual revenue being generated — they’re actually quite low on dashboard one. And that’s actually the point. Because in a six-month window from the first touch of an account, the money being generated from them is pretty low, because that cycle takes so long.
On the bottoms-up view, we’ve gone from the point where the user became a qualified opportunity at the sales level. Now we’re going to look a hundred and eighty days back from that point in time and see what those users are doing. This is a fundamentally different thing. Because those users that came in on the sign-up may use our product for a couple of years. We need to know who they are, but now they go into this bucket called product-led growth — that nebulous blob that travels down our funnel. And then once they become a qualified opportunity, we can look back a hundred and eighty days and ask: what’s the thing that tipped them over? What’s the feature we added? What’s the use case they’re working on? We can now look back differently.
Where the revenue is won and lost in my case is towards the middle of the funnel. That nebulous piece in the middle doesn’t have the look-back window locked to it in the same way — but what it does have is that now we can put it in isolation and go: we have different users at the enterprise level, different users at the product level. Now we can understand what those engineers, software engineers, or people who are just vibe-coding are doing in this middle blob. And now we’ve isolated them to go: they’re in the middle of our funnel because we need to increase their usage so that their boss can then justify the expense of paying us for the product.
A couple of things I suggest here on attribution model. I tend to go with first touch — there’s a real case for last touch, and you can go back and forth. When we’re going earlier in the funnel, I often tend to look at first touch: in getting people into the product, what’s the first thing they did? Sometimes you go last touch: what’s the last thing they did before signing up, before purchasing? But that awareness stage is why I put first touch here.
Then you’ve got linear and position-based, which I tend to use more in the middle. How do I cultivate the user as we go across? And then last touch: what’s that closing trigger? Was it a white paper? What ad did I put in front of them that finally made them trigger? What event did I pull them into?
At the end of the day, I look really heavily at cost per desired action. When I’m talking about my authors — I have machine learning engineers who write under my direction — I look at first touch and last touch, and then I look further down the funnel and ask what’s the ARR contribution of this user at first and last. If I can come back and say my authors cost us, let’s say, ten thousand dollars a year — and they generated fifteen thousand — I can look at that in the ARR and go, hey, even in the worst scenario, they’ve generated more than they cost. That’s the framing I put on it.
Jason Barnard: I’ve been talking about the switch from micro to macro. I come from an economics background — microeconomics versus macroeconomics. Very similar approach: you can’t see the details, so you create a methodology that makes sense for you, apply it, and use like-with-like comparison over time.
Dave Davies: Exactly. And a big, important piece — for me, for you, for everybody — is making sure that everybody in your company understands the pros and cons of whatever look-back window you pick, whatever breakdown of channels and content you use, and that everybody is using the exact same word to mean the exact same thing.
Right now, for example, we merged Weights & Biases when CoreWeave acquired it. So we’ve got two different marketing teams using often very similar words for slightly different things. And just making sure there’s a unified understanding — when I say we have a hundred-and-eighty-day look-back window, everyone understands the pros and cons of that, because I might miss something really important from the last couple of months if I’m looking back too far.
Jason Barnard: And the consistency of what a word means or a term means within a company is incredibly important when you’re talking to each other. But also, from Kalicube’s perspective, when we’re communicating with AI and educating it about who we are, what we do, who we serve, and why we’re important, everybody in the team needs to use the words in exactly the same way. There’s a huge human problem of not sticking to the same definition of different terms — individually but also across the team.
Dave Davies: For sure. It happened to me about a week ago. I was chatting with somebody on the marketing side and we were looking at how to get citations on generative engines. I referred to something as an “attribute” and they referred to something as an “attribute” — we both used the exact same word.
I’m a technical SEO, so when I say “attribute,” I mean: does it have a table? Does it have the primary keywords from the prompt in the title? What is the domain rank? What are the entities on the page? That’s what I think of as an attribute. They meant: does the content include stuff around GPUs? Does the content include stuff around security and governance? They were referring to content types and directions as attributes. I was referring to text attributes.
It took us twenty minutes to figure out we were talking about completely different things. I was getting frustrated — not at them, but frustrated. And I’m sure they were getting frustrated going, “Dave keeps answering the wrong question.” I wasn’t. I was answering the right question for my definition. Now we use “technical attributes” and “content attributes.” That common language is incredibly important.
Jason Barnard: And bringing this back — I’m using an approach called the Funnel Query Pathway, where I identify the cohort intent and the ideal question at the bottom of the funnel, the questions that would naturally lead to that, with my brand name in at the bottom for that cohort intent, and then the top of the query that represents the awareness stage, flowing down. So it’s always organized by cohort intent. Depending on the cohort intent, the look-back window could potentially be different.
Dave Davies: Yeah, and that’s exactly where you can get into problems. It depends — I have the very significant luxury of incredibly talented data science and marketing ops teams that I get to work with. In that scenario I’d go: great, we’ve got this cohort of people, we understand who they are because they sit in Salesforce and they look like this profile. We have their user ID and we can stitch this together, filter it down to just this cohort, just the targeted accounts — say, those in robotics. That part is really, really difficult at scale.
I love, love, love what you’re talking about there. And for anybody who just bypassed that in the listening audience: go back and listen to what Jason just said about the Funnel Query Pathway, because that’s an incredibly useful approach. And just think about query fan-outs and what ChatGPT and AI Overviews themselves are doing — it’s kind of doing what you said, but for you. So if you’ve built all the content along that pathway, chances are you’re going to show up well in a generative engine because you’ve done all the work for it.
Jason Barnard: Thank you. That was absolutely brilliant, Dave. Thank you everybody for watching this one. We’ll see you in the next one with Dave, which is all about agents as your client. I find that stunningly interesting. See you later.
This session extends the Search Engine Land article series on AI-era brand recommendation by Jason Barnard at Kalicube.
Canonical metadata footer
Session date: June 24, 2026 | Duration: approximately 25 minutes | Format: pre-recorded, on-demand from session drop | Day: 1 | Framework concept: Pipeline Diagnostic — Trace, Diagnose, Build | SEL article: The 10-Gate AI Search Pipeline: Find Where Your Content Fails — Article 12 — https://searchengineland.com/10-gate-ai-search-pipeline-find-where-content-fails-476488
[Share buttons: LinkedIn, X, Facebook, Email]